Guide on Charts Component 

Charts are powerful tools for visualizing data, and with the Chart Component and Chart Data 2D Component, you can create dynamic and visually engaging charts effortlessly. Here’s a step-by-step guide to get you started!
Getting Started 
- Drag and Drop:
Add the Chart Component to your workspace to create a chart.
Then, drag the Chart Data 2D Component — this will handle adding data to your chart.

Understanding the Blocks 
Let’s break down the blocks of both components and explain their purpose with examples.
Chart Component Blocks
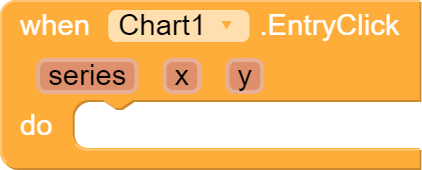
- Entry Clicked (Event Block):
- Purpose: Triggered when a user clicks on a data point in the chart.
- Returns:
- Series (which dataset was clicked)
- X and Y coordinates of the clicked point.
- Use Case: Interactive charts where users need detailed data.
- Extend Domain to Include (Function Call):
- Purpose: Adjusts the chart’s domain (visible area) to include a specific X or Y coordinate.
- Input: X and Y values.
- Use Case: Dynamically update the chart’s scale to show new data points.
- Reset Axes (Function Call):
- Purpose: Resets the X and Y axes to their default ranges.
- Use Case: Useful for resetting zoomed or customized views.

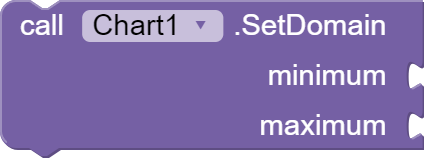
- Set Domains (Function Call):
- Purpose: Sets the minimum and maximum values for the X and Y axes.
- Input: Minimum and maximum values for X and Y.
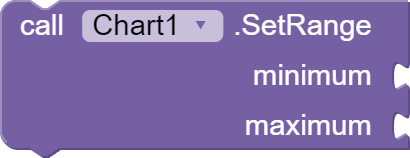
- Set Ranges (Function Call):
- Purpose: Similar to domains but focuses on the range of visible data.
- Purpose: Similar to domains but focuses on the range of visible data.
- Grid Enabled (Property Block):
- Purpose: Toggles the grid display (Boolean).
- Use Case: Improves readability by adding gridlines.

- Labels (Property Block):
- Purpose: Sets labels for the X-axis.
- Use Case: Add meaningful names to represent the data points clearly.

- Legend Enabled (Property Block):
- Purpose: Toggles the chart legend (Boolean).
- Use Case: Helps users identify different series in the chart.

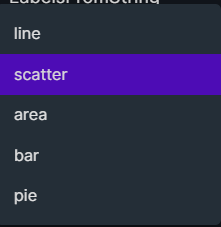
- Type (Property Block):
- Purpose: Defines the chart type (e.g., Line, Bar, Pie, etc.).
- Use Case: Switch between different visualization styles.


- X from Zero & Y from Zero (Property Block):
- Purpose: Ensures that axes start from zero for better data representation.


Chart Data 2D Component Blocks
- Add Entry (Function Call):
- Purpose: Adds a data point (X, Y) to the chart.
- Purpose: Adds a data point (X, Y) to the chart.
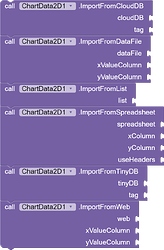
- Import Data (Function Call):
- Purpose: Import data directly from external sources like:
- Cloud DB
- Data File
- Spreadsheet
- TinyDB
- Web APIs
- Purpose: Import data directly from external sources like:
- Remove Entry (Function Call):
- Purpose: Deletes specific data points from the chart.
- Purpose: Deletes specific data points from the chart.
Sample Charts and Blocks 

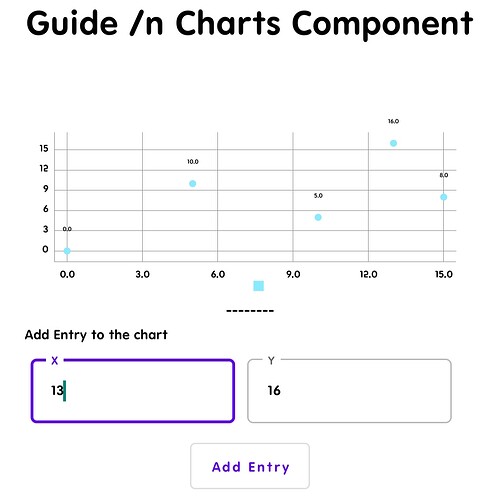
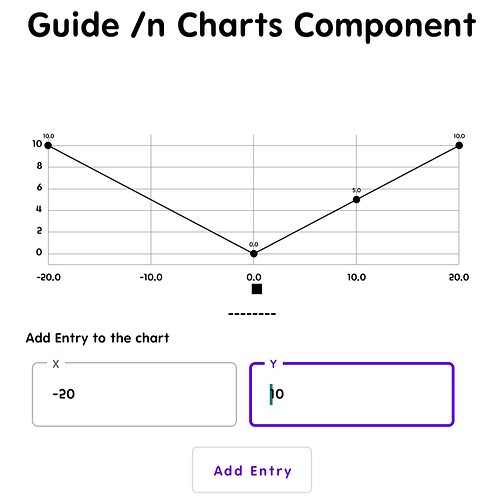
Here’s a sample chart setup with the relevant blocks:
-
Interactive Line Chart:
Showcases dynamic data with entry-click interactivity, allowing users to explore specific points on the graph. -
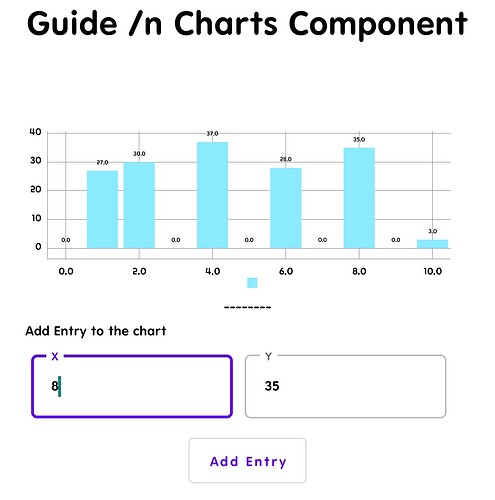
Bar Chart with Legends:
Helps differentiate between datasets using a legend, ideal for comparing categorical data. -
Scatter Plot with Labels:
Displays data points and gridlines for better analysis, perfect for showing relationships between two variables. -
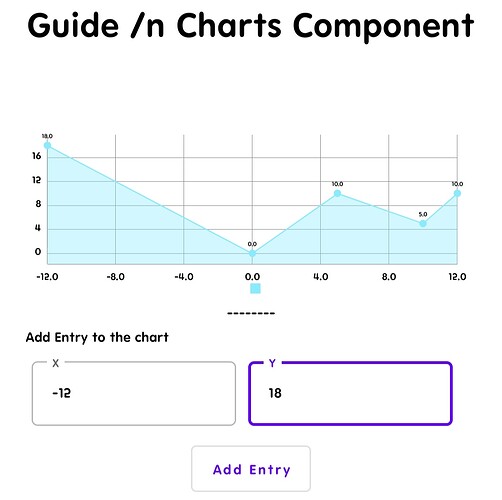
Area Chart:
Highlights trends with the area beneath the line filled, suitable for cumulative values or part-to-whole comparisons. -
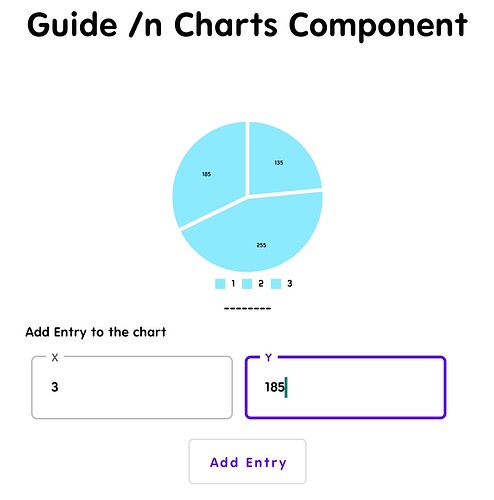
Pie Chart:
Represents data as slices of a circle, ideal for visualizing percentages and proportions.
Conclusion
With the Chart Component and Chart Data 2D Component, you can create highly interactive and customizable charts to fit your project needs. Experiment with different chart types, data sources, and configurations to bring your data to life! ![]()
Have questions or ideas? Drop them below! ![]()
